Morgan Stanley
Morgan Stanley serves about 6.8 million households, with approximately 3.5 million clients using their Spending & Budgeting tool.
Timeline: 1.5 years
Team: 2 PMs and 14 Engineerings
Role: Lead Designer

Project Context
-
The Problem
When they acquired E-Trade, Morgan Stanley’s new goal was to serve a younger demographic that is now part of Morgan Stanley but does not have the mass wealth of their older clientele. Also, some tools were unavailable throughout the experience, causing a massive drop-off rate of 25-30% from the Spending & Budgeting tool.
-
My Solution
My solution was to explore different hierarchies and interactions based on the Project Owners' requirements by conducting an internal workshop and competitive analysis, exploring different interaction models, and validating the designs through testing internal FAs and external potential clients and applying accessibility best practices.
-
Goals
• Explore a new interaction model that shows the relationship between cash flow and expenses
• Compromise with PMs to add business value while focusing on user needs within the product
• Collaborate with engineers to build data visualization that is accessible amongst technical constraints
I held several workshops with stakeholders, which led to creating a persona and, as well as conducting a competitive landscape analysis.
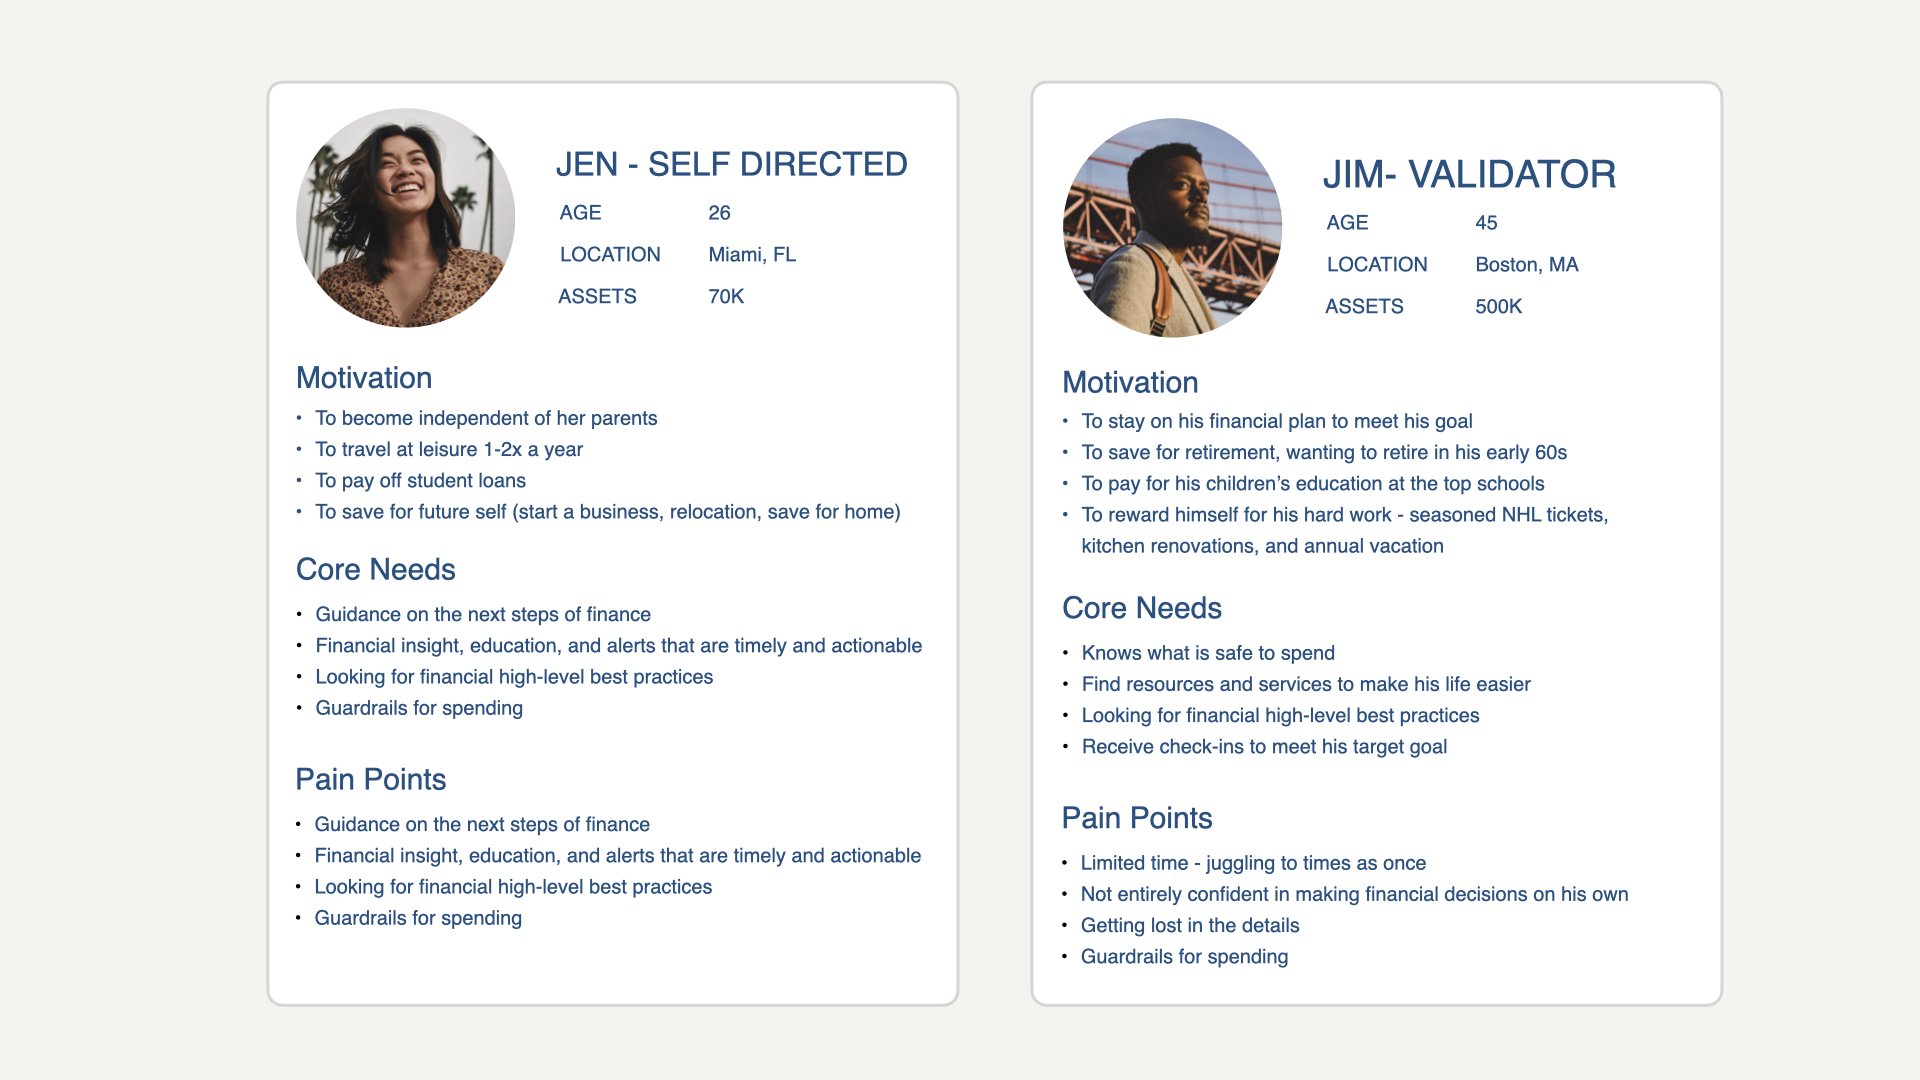

I explored two different hierarchies and validated the experience with internal financial advisors. After choosing a direction, I conceptualized the experience with the PMs, and I landed in two different directions. I then conducted usability testing with five different consumers who use Spending and budgeting tools regularly.
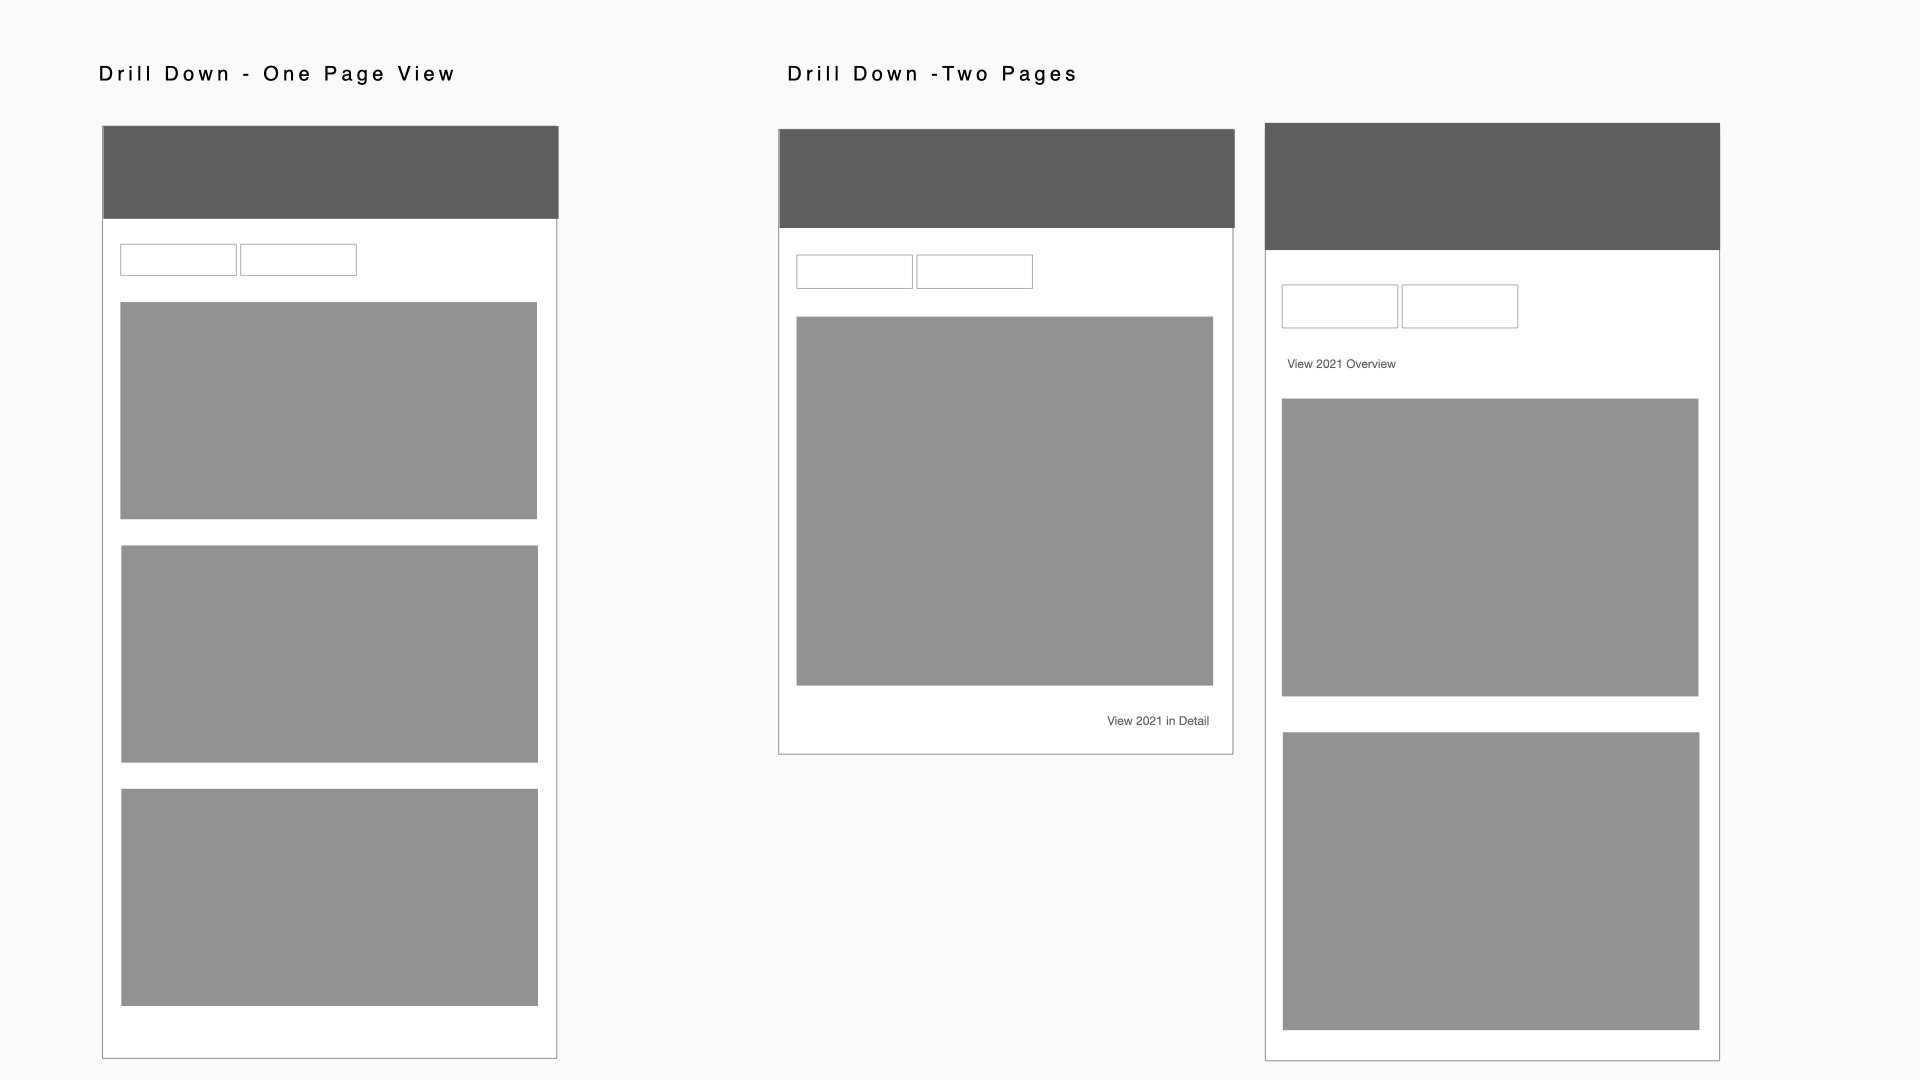

The PMs wanted to explore an experience of explore the Spending and Budgeting tool on a yearly bases, dividing to the monthly breakdown per users discretion.

Based on the competitive landscape, I thought I would explore different monthly intervals. Also, my group lead was apprehensive about the cascade experience, so I designed an experience where the cash flow and expense chart operated independently.
Usability Testing Results
-
Drilldown Experience
All users respond positively to the drill down, interconnect approach between the sections. Five of the six users liked the high-level to detailed flow and believed it was intuitive for the average user.
-
Time Intervals
Users default to their monthly analysis of their Spending + Budgeting and zoom out occasionally in time intervals of 3, 6, and 12 months.
-
Cascade Interaction
Overall, users understand the cascade effect . However, four of the six users did not understand how to return to the default state.
-
Essential and Discretionary Info.
Users understood that it was essential and discretionary; all users failed to find the specific category because each category was defined differently.
-
Pie Chart
All users understand the relationship between the Pie Chart and Transactions. However, returning to the pie chart's default state was tedious, and the affordance was not immediately recognized.
-
Overall Experience
Overall, users understand the intuitive interactions throughout the tool.
Adding Month Time Intervals
Because users default to monthly analysis, I designed a date range option allowing clients to see the tool at different intervals.

Cascade Interaction
Because users did not understand how to return to the default state in the cascade interaction, I added a “Reset” CTA to help to recenter the client.

Adding Month Time Intervals
Because clients felt that essential and discretionary were subjective, I designed an “all” option, along the client to see all of their expenses.

Creating an Accessible Experience
Working with the accessibility team, I explored a table experience for daily and monthly intervals.

Results
When I left Morgan Stanley, the responsive experience saw a 25% increase in user retention with its 3.5 million users. The product was shortlisted for a Banking Award.